Visualisation primitives for FoldKit

Give your
data
shape.

Build expressive charts with Foldkit, the TypeScript frontend framework built on Effect. Pure geometry. Composable SVG. State and interaction you can understand.

Six stacked activity series across twelve months. Focus a month to read its total in thousands.040k80k120kCoreToolsCommunityJan · 74kJanFeb · 89kFebMar · 74kMarApr · 80kAprMay · 97kMayJun · 104kJunJul · 90kJulAug · 80kAugSep · 99kSepOct · 107kOctNov · 124kNovDec · 130kDec
Built with Foldkit Viz Illustrative data · Hover or focus a month

New / In the workspace

Follow a signal. Find the words.

Explore the primitives
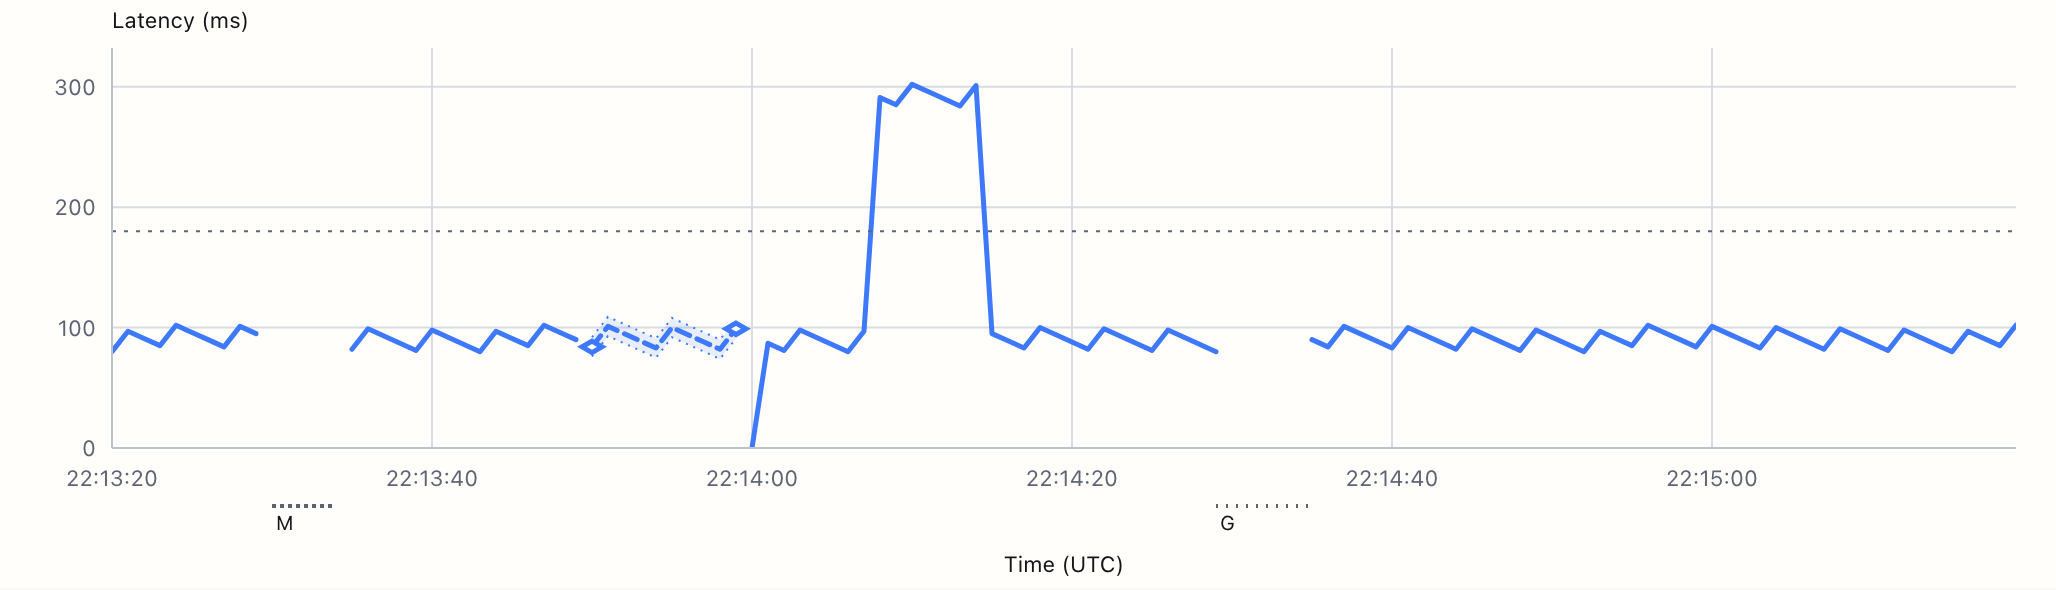
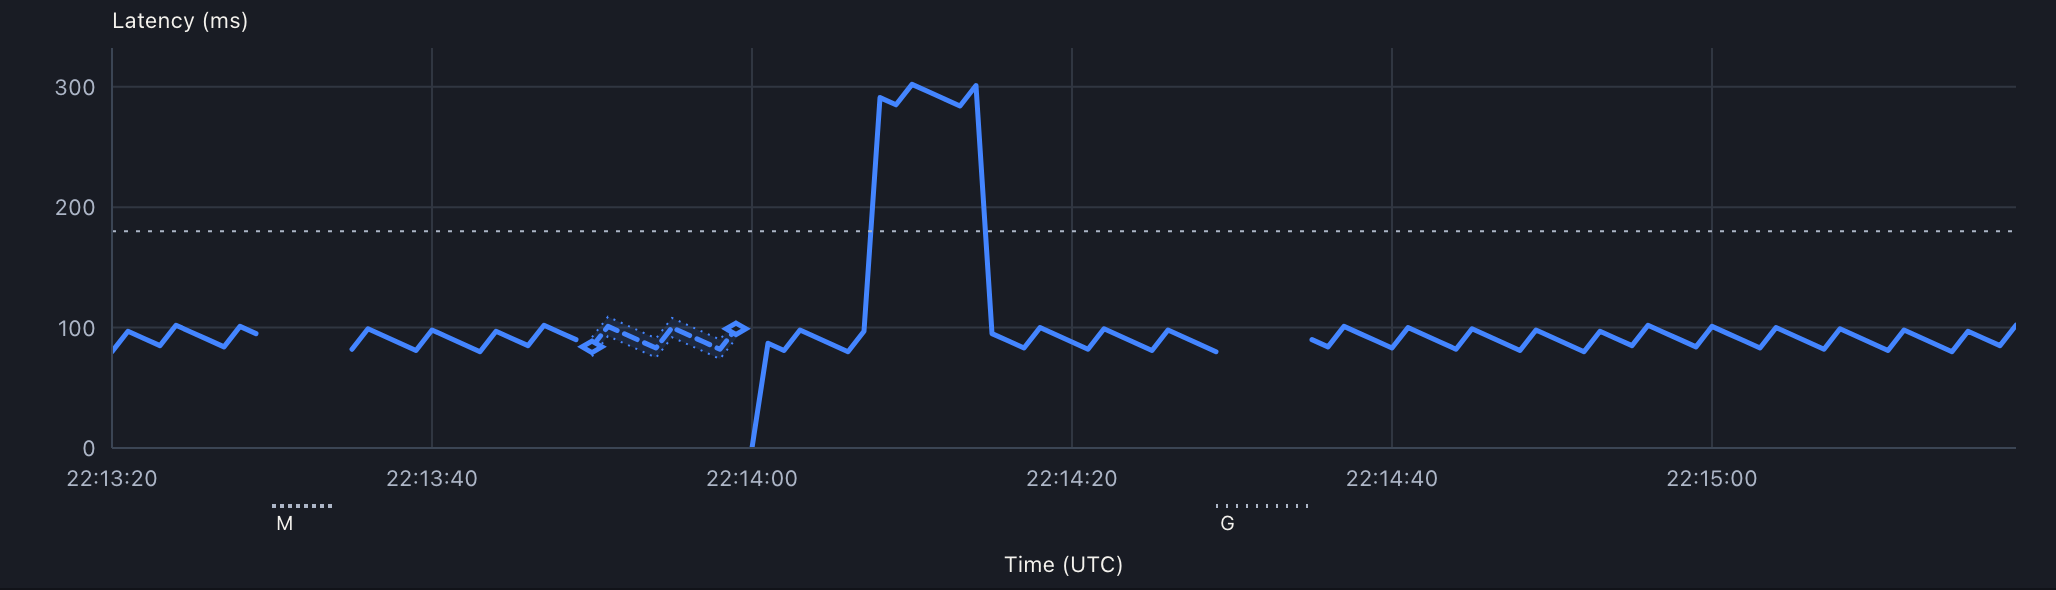
Signal Desk preview: latency over time, with explicit gaps and a supplied interval around estimated observations.Signal Desk preview: latency over time, with explicit gaps and a supplied interval around estimated observations.

A moment in context. Missing observations, supplied intervals and a baseline that stays put.
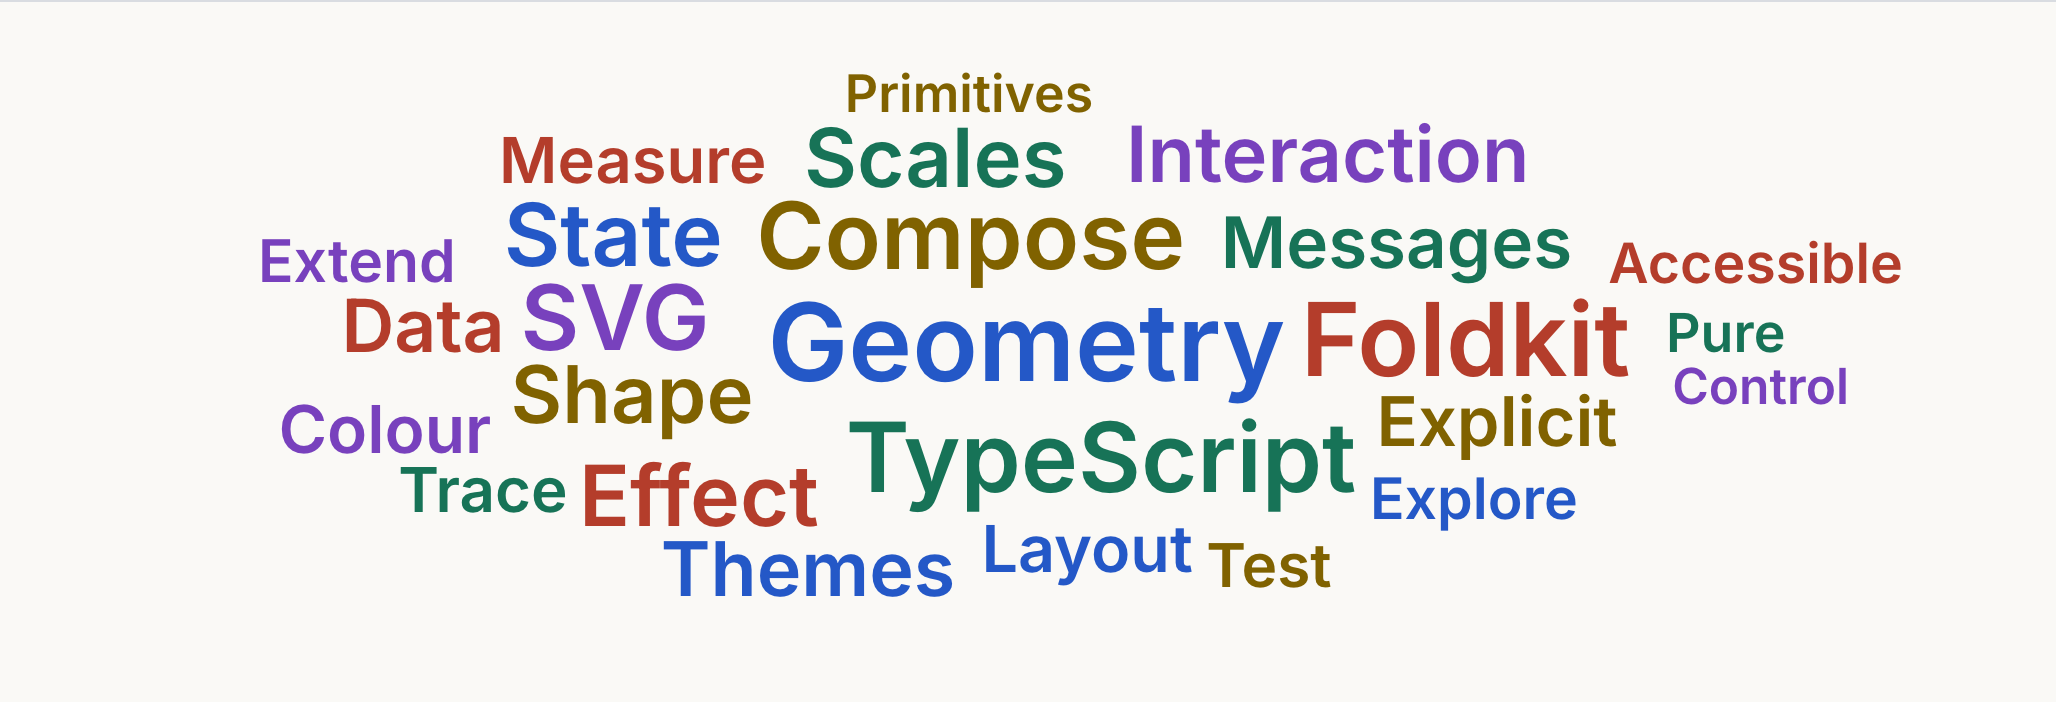
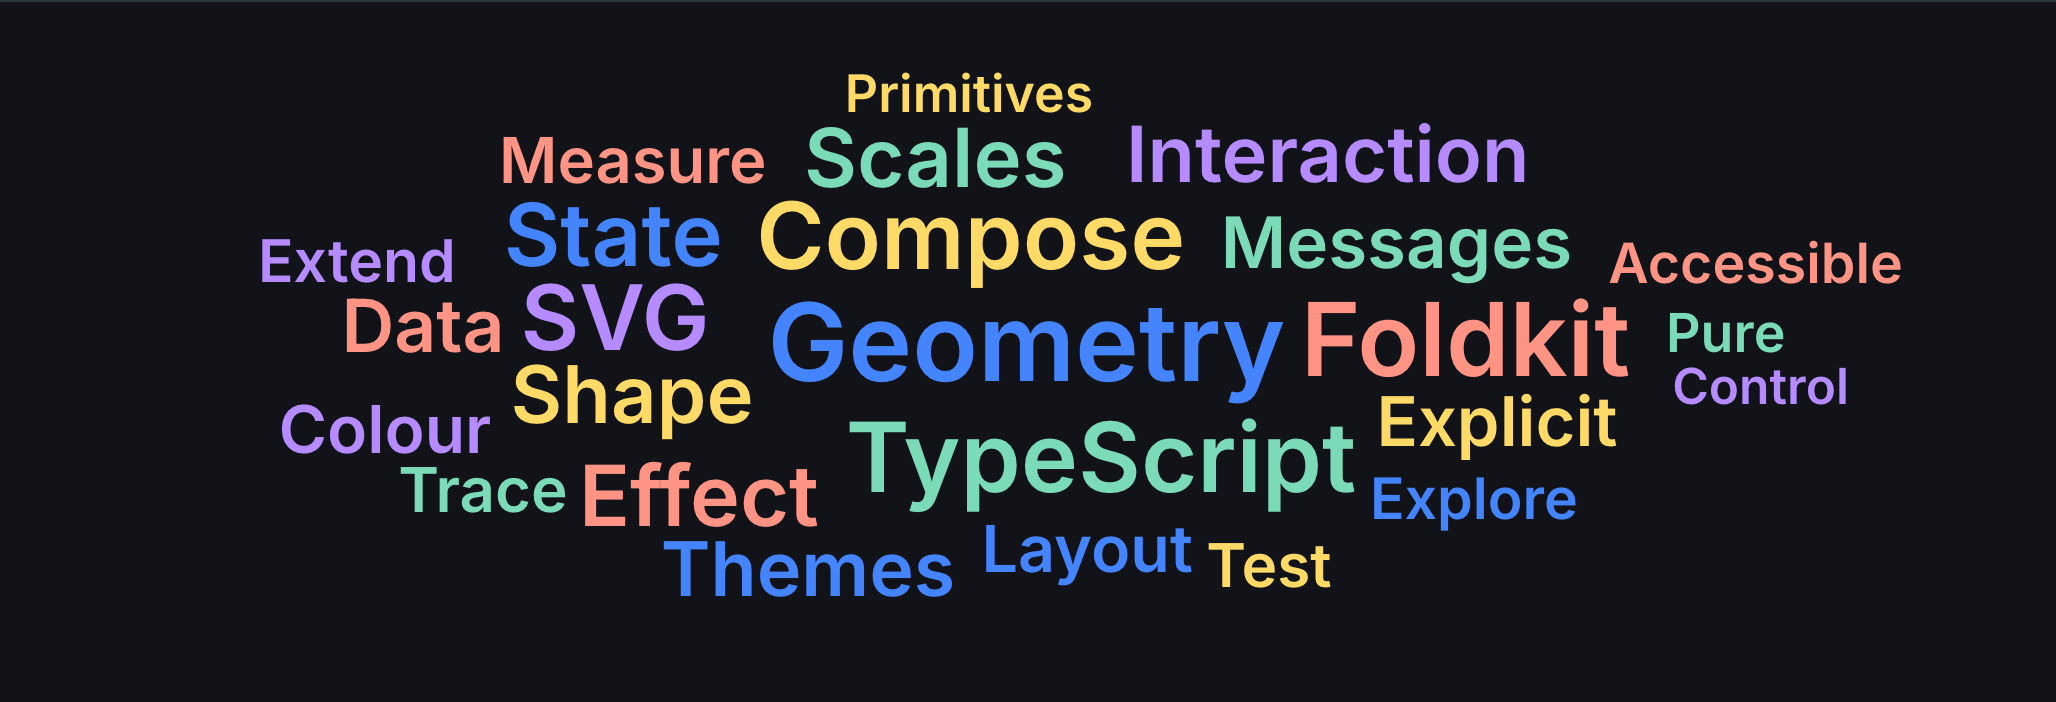
Word-cloud preview: visualisation vocabulary arranged without overlap and sized by illustrative weight.Word-cloud preview: visualisation vocabulary arranged without overlap and sized by illustrative weight.

Give words their weight. Measured type, deliberate space and a layout you can reshape.

Pure geometry

Scales, shapes and layouts in pure TypeScript. No D3 dependency.

Composable primitives

Start with a scale. Add a shape. Bring your data, colours and creative direction.

Explicit interaction

Build on Foldkit’s model, messages and commands. Trace how your charts behave, test their state, and extend them with confidence.

From values to visuals.

Start with a scale. Add a shape. Make it yours.

Read the quick start
const x = linear({ domain: [0, 10], range: [0, 400] });
const path = line(points, { curve: 'catmullRom' });